Category Archives: Business Intelligence

Strategies for growing hospital volume

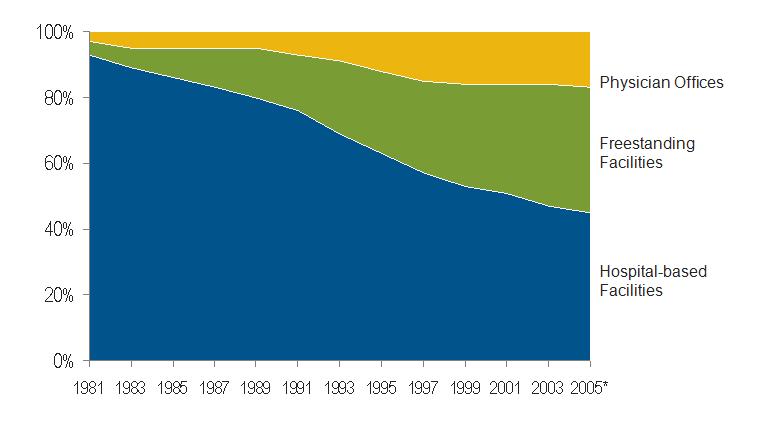
Volume trends in US healthcare – Shift from hospital to non-hospital settings

Over the past five years, hospital inpatient and outpatient admissions are growing at a much smaller rate than non-hospital based outpatient services. A clear case in the point being outpatient surgeries. Increasingly, outpatient surgeries are moving to non-hospital based settings, taking with them the observation, follow-up and possibly some Med surg volumes (see below)

outpatient_surgeries

Competition for Market share

The current payment system is also fuelling this trend, as it gives non-hospital providers an advantage in that they are able to focus on most profitable services (such as opthamalogy). While, hospitals face a higher cost structure to support unprofitable but essential services (such as inpatient psychiatric units). In metro areas like Houston, for instance small, ful service facilities are springing up as a result of joint ventures between physicians and Wall street based venture capital funds.

This means now more than ever, traditional hospitals need to have strategies in place to fight for market share with these free standing centers.

5 Strategies for maintaining and growing volume

1. Increase outpatient services capabilities to compete on equal footing with freestanding ASCs

2. Consolidate core programs to better withstand market competition – Build strong programs in profitable areas such as thoracic surgery, ENT and Oncology

3. Integrate physicians into strategic planning, management and governance – A close analysis of the freestanding ASC type centers reveals over 60% of these facilities are developed by physicians or physicians in conjunction with another entity.

4. Build in Quality and increase it’s visibility – Do what Toyota did in the auto industry. Drive process and quality improvement and build your hospital brand around these initiatives and outcomes (Eg: Lowest infection rates in the city).

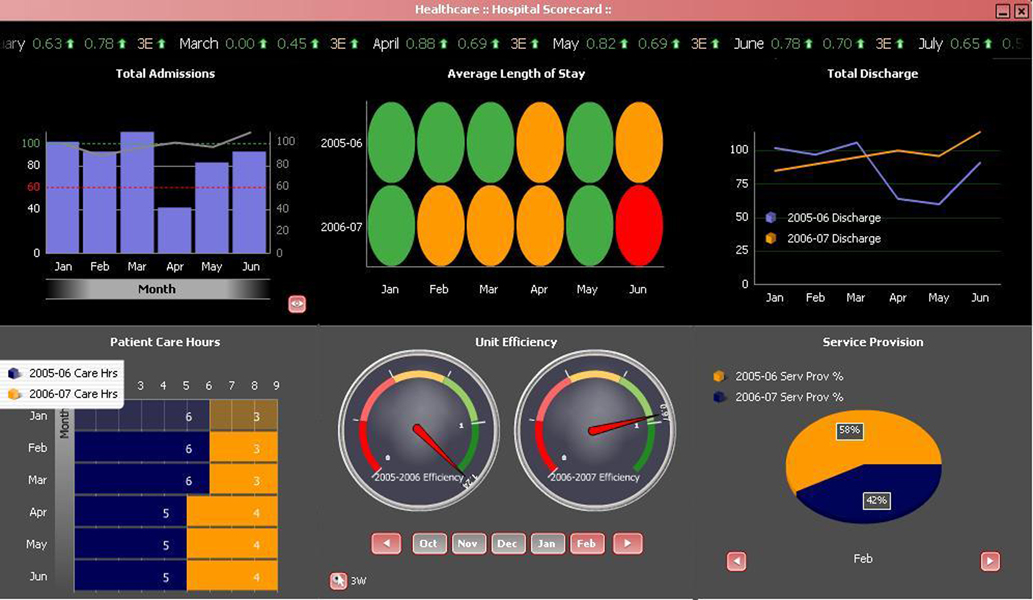
5. Invest in and utilize Business intelligence – To stay ahead of the curve you need to know, where you are in relation to your competition so continuously and rigorously measure and feedback business intelligence to your managers and administrators

Healthcare economy: How much countries spend on healthcare

Let us examine some interesting facts on healthcare spending.

U.S. Health Care Spending to Double by 2017

According to a recent report published in the online edition of Health Affairs,U.S. healthcare spending is projected to reach $4.3 trillion. This equates to approximately one fifth (or 19.5%) of the gross domestic product(GDP).Hospital spending is expected to increase and gradually slow down through 2017, going from $696.7 billion in 2007 to more than $1.3 trillion in 2017. Prescription drug spending is expected to slow down initially and then start to accelerate through 2017. Drug spending will increase from $231.3 billion in 2007 to $515.7 billion in 2017.

Healthcare spending to double in India by 2012

For an emerging economy, India spends a small $14.8 billion on healthcare which equates to roughly 5.2% of the GDP. This will however change quickly and the country is expected to spend $33.6 billion by 2012 with healthcare spending accounting for 8.5% of the economy.

Here is a graph comparing spending for some countries as a % of their GDP of their stack up currently (Source: WHO Health Statistics,2007).
health_spendj

Managing hospitals with dashboards

Air traffic control

There are many areas in a hospital that need dashboards to be able to identify and resolve problems. Let us look at an example. In many ways, a bed management or bed control function in the hospital is like an Air Traffic Control. They they control the take off (discharges) and landings (admissions). In hospital terms they control the patient flow from several areas such as emergency and surgery to Inpatient units. But, there is one major difference between an air traffic controller and a hospital bed manager. While the former has ‘real time’ information and visual indicators to make decisions, the latter relies on numerous phone calls,faxes and experience to make their bed decisions. Naturally, the decisions are delayed or sub optimized (like when patients are shifted to a higher level of care even when there is not need for it). The result is bottlenecks and delays throughout the system. Which in turn increases ‘patient days’ and negatively impacts clinical and financial outcomes.

Visual view of data

Hospitals in the US, tend to collect terrabytes of data annually. But the data is not useful in and of itself. Because, it remains inactionable unless its visually processed and represented in the form of a meaningful dasboard with bells and whistles built in. Reverting back to our example, if we do not have a handle on our daily/hourly admissions, length of stay and patient care hours and other key performance indicators, it is virtually impossible to reduce delays and length of stay for patients.

So what should a hospital dashboard look like. We did some research and found a great example. One of the best designs we found from our research was iDashboards . So check it out below !!!
hospital_scorecard